

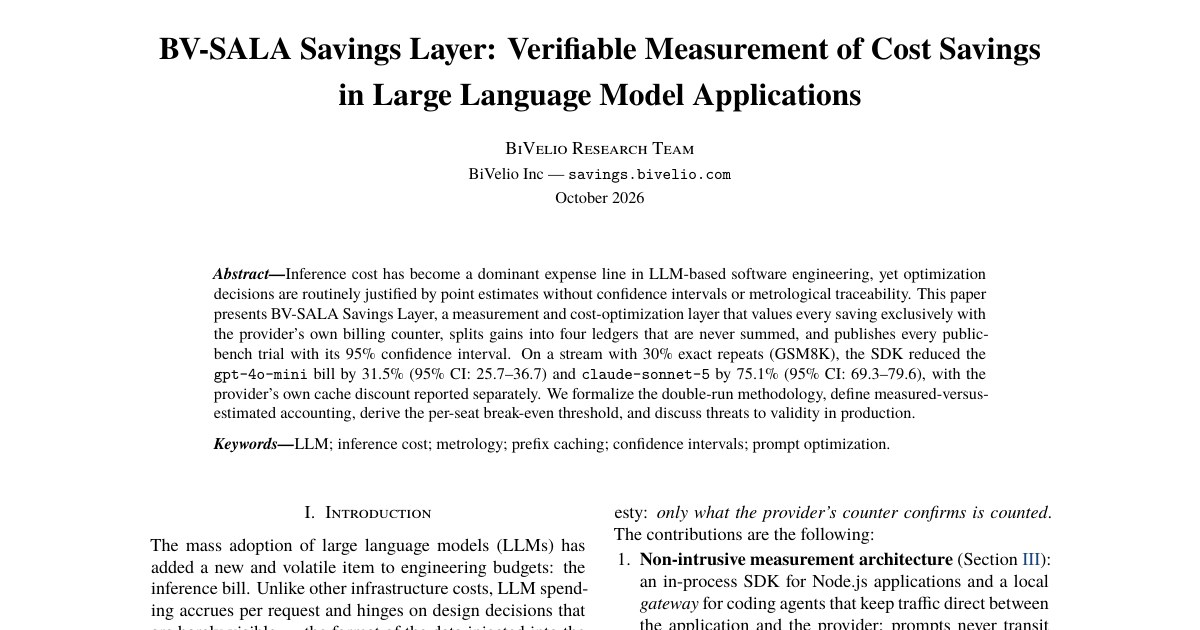
BV-SALA Savings Layer: Verifiable Measurement of Cost Savings in Large Language Model Applications
How to measure the cost savings of a layer in front of an LLM without inflating them: only what the provider’s own billing counter confirms counts as a saving, every scenario is measured twice (with and without the layer), savings are split into four ledgers that are never summed, and every figure is published with its 95% confidence interval.
Abstract
Inference cost has become a dominant expense line in LLM-based software engineering, yet optimization decisions are routinely justified by point estimates without confidence intervals or metrological traceability. This paper presents BV-SALA Savings Layer, a measurement and cost-optimization layer that values every saving exclusively with the provider’s own billing counter, splits gains into four ledgers that are never summed, and publishes every public-bench trial with its 95% confidence interval. On a stream with 30% exact repeats (GSM8K), the SDK reduced the
gpt-4o-minibill by 31.5% (95% CI: 25.7–36.7) andclaude-sonnet-5by 75.1% (95% CI: 69.3–79.6), with the provider’s own cache discount reported separately. We formalize the double-run methodology, define measured-versus-estimated accounting, derive the per-seat break-even threshold, and discuss threats to validity in production.
Keywords: LLM; inference cost; metrology; prefix caching; confidence intervals; prompt optimization.
The breakdown behind those figures is under Results: of the 75.1% on claude-sonnet-5, about 41 percentage points are the provider’s own prefix-cache discount, which the system reports separately.
Results
The three public-bench trials with a published figure. Both members of each A/B pair are billed with the same instrument: each provider’s own counter. These are the figures of the paper’s Table 2 and Figure 2, as a table so they can be read without the image.
| System and model | Bill reduction | 95% CI | Scenario |
|---|---|---|---|
SDK · gpt-4o-mini (OpenAI) | 31.5% | 25.7 – 36.7% | GSM8K stream with 30% exact repeats; SDK 0.4.31 |
SDK · claude-sonnet-5 (Anthropic) | 75.1%, of which about 41 pp is the provider’s own prefix-cache discount | 69.3 – 79.6% | Same stream |
| Gateway · PRO lever on Anthropic (cache TTL) | 2.5% net | 1.5 – 3.6% | 51 Claude Code sessions of a single organization (the team’s own), at list prices |
How to read the 75.1%
It is not a 75% saving attributable to the layer. About 41 percentage points of the original bill correspond to the discount that the provider’s own prefix cache was already applying; the system reports it separately, in the fourth ledger (provider_cached_tokens), not as savings of the layer. The remainder comes from the avoided-calls ledger: repeated requests are served without a new call to the provider.
The result is not a forecast: savings depend on how much repetition an organization’s own traffic contains. The gateway’s 2.5% is already net of the cache misses the lever itself causes on chained turns; it is a small saving that mainly signals where spending concentrates. On Gemini, the layer has been verified not to break anything, but no savings figure is published: without a published interval there is no figure.
Method: a double run against the real provider
Every figure comes from measuring the same scenario twice, on the same model and the same content: without the layer (the base condition) and with it. The amount for each condition is the one the provider’s official billing counter attributes to it — not an in-house tokenizer or a price card, which would introduce a systematic bias (tokenizers that differ from the one the provider bills, outdated prices, discounts not applied). The primary metric is the relative reduction of the bill, and its 95% confidence interval comes from non-parametric resampling (bootstrap) of the per-request costs measured in both conditions.
The system’s editorial rule is explicit: a percentage without its interval, its model and its traffic means nothing, so all three are published together for every bench trial.
Four ledgers, never summed
The per-request savings report (SavingsReport) splits savings into four ledgers that are reported separately. Summing them is deliberately avoided: it keeps savings from being inflated by double counting (a token served by the provider’s cache cannot also be presented as the layer’s saving), and each ledger answers to a different lever with its own dependence on traffic.
| Ledger | Content and valuation criterion |
|---|---|
avoided_calls | LLM, retrieval or tool calls that were never executed; valued with the counter reading of the identical request already executed. |
eliminated_tokens | Information removed from the prompt because it was not needed; valued with the provider’s counter. |
compressed_tokens | Information kept but encoded with fewer tokens (e.g., rewriting of structured data). |
provider_cached_tokens | Tokens that remain in the prompt but that the provider bills cheaper through its own prefix cache. This is the provider’s discount, not the layer’s, and it is reported separately. |
Every amount is also classified as measured (backed by a reading of the provider’s counter) or estimated (valued with price cards or with the counter of an equivalent request). A stream without a final counter reading is logged as unmeasured and feeds no measured-savings figure.
Limitations stated in the paper
- The ledgers are not summed, by design: no single figure summarizes the layer’s total effect; the reader must work with the breakdown.
- The published package includes no compressor: the compression ledger only activates with structured data.
- The gateway’s agent coverage is partial, and the subscription skill still lacks a published A/B measurement, so no figure is associated with it.
- The figures come from specific contexts (an academic stream, GSM8K, with the repeat rate fixed at 30%, and 51 sessions of a single organization at list prices); none should be read as an individual forecast. The defensible extrapolation is to measure your own traffic’s repeat rate in shadow mode.
- The commercial origin of the work — a team evaluating its own product — demands treating the figures as declared and reproducible through the public bench, not as verified by a third party.
In BiVelio Factory
This paper is product 01 on the output dock of BiVelio Factory, where the applications, papers and companies that leave the factory appear. The algorithm whose savings it measures is explained in BV-SALA · BiVelio Savings Layer.
Download and cite
Download the paper as a PDF (7 pages, 612 KB). The public bench with the trials is at savings.bivelio.com.
How to cite it:
BiVelio Research Team (2026). BV-SALA Savings Layer: Verifiable Measurement of Cost Savings in Large Language Model Applications. BiVelio Inc, October 2026. https://research.bivelio.com/en/papers/bv-sala-savings-layer/
For more context on the algorithm: BiVelio Savings Layer and the article BV-SALA: inside the LLM cost layer.
- #paper
- #bv-sala
- #llm
- #inference-cost
- #metrology